Intro to Statistics

Source: Information is Beautiful 2018 Awards - Data Visualisation Created by Dimiter Toshkov
Notebook Outline
- Recap of Module 4
- Learning Outcomes
- Introduction to Statistics
- Data Collection
- Descriptive Statistics
- Inferential Statistics
2. Learning Outcomes
By the end of this module you will have
- a better understanding of what is Statistics and what questions it might help you answer
- learned about data collection and its importance
- learned what are descriptive statistics
- a better understanding on how to describe data effectively to convey facts
- learned how to explore your data more effectively by grouping different sets of information in categories within your data
3. Introduction to Statistics
Statistics is one of the most widely used areas of mathematics. It helps us mere mortals collect, describe, and make inferences about natural and unnatural phenomena using data. It allows us to approximate answers to questions that were thought to be impossible to answer. In addition, a large number of scientific advancements have used this area of mathematics to quantify, test, validate, and improve our answers to problems with a wide range of complexities. For example, Albert Einstein and his groundbreaking theories of Special and General Relativity used statistics to approximate the movement of the sun in relation to that of other bodies of masses. To provide you with a more formal definition of statistics, the UCI Department of statistics has defined it as:
"...the science concerned with developing and studying methods for collecting, analyzing, interpreting and presenting empirical data."
Empirical here means based on observations and verifiable evidence as opposed to logic and deduction. In essence though, statistics as a field is broadly divided into three categories, data collection, description (analysis), and inference.
Now that we know what "Statistics" is, let's define what "A Statistic" means. A Statistic is a piece of evidence or a fact obtained via a calculation performed on a sample of data. When you hear comments on the radio or read news statements that begin with, "the average rugby player...", "the average Australian nowadays...", etc., you are essentially being given "A Statistic". A fact compiled from data coming from (most likely) a smaple or a population.
What is a Sample? A sample is a fraction of the population. For example, the students in this course are a sample of the overall number of students in Australia. In this case, the number of students in Australia would be considered the total population of students, and the students of this course the sample.
What is a Population? The population is all of the data available for a particular questions, problem, or phenomenon. It is a set of data with some similarity, and it represents the whole from where a sample is drawn from. Think about a cake sliced into pieces, the full cake is the population and a slice of it is the sample. Our friend Mickey can show us a good representation of this example.

Going back to the example above, all students in Australia would be the population and one of the defining characteristics of this population is that they would all have to be active students. If we needed, for example, the address of every one of these students but were unable to get, say, 10 of them, we would call the set of students belonging to that characteristic, the address, a sample as it is a fraction of the full set. Another way to put it would be Population - 10 = Sample.
So, what can we do with Statistics?
- We can learn from information.
- Draw informed conclusions based on evidence.
- Simulate the reality in a completely made up world.
- Mine massive amounts of data and extract relationships from them.
- Spot liars and deal with outliers.
- Separate correlations from causation.
As one of the most famous statisticians put it,
“The best thing about being a statistician is that you get to play in everyone else’s backyard.” ~ John Tukey
What should we not do with Statistics?
- Lie/deceive others.
Source: "How to Lie with Statistics" by Darrell Huff, 1954
- Assume that because two things seem to be related to each other, one causes the other. A famous example of this was given by Franz H. Messerli, MD in 2012. He found a surprisingly large positive correlation between the chocolate consumption of a country and the amount of Nobel Laureates that same country has produced. See below.
- Overgeneralise results. Just because an analysis of a group of consumers found that 60% of them buy goods before a holiday does not mean that 60% of all humans do.
- Avoid falling pray of confusing annecdotal evidence vs real evidence. For example, XYZ thing happened to both of my friends, hence, this happens to everyone or all the time.
Now let's talk about data collection.
2. Data Collection
It is very important to have a question, project or idea you wish to explore before moving onto the data collection part. The idea behind this is that once you have some context on what you would like to study, you might be able to search for that information more efficiently. For example, (1) if you need to study the profitability of a movie theatre in a given year, you would need data about sales and airing times for the movies shown within your specific timeframe. (2) If you would like to evaluate peoples' sentiment towards a political candidate on social media, you would need social media data and might benefit from looking in Twitter first. (3) If you want to test the effects of a newly developed drug are real, you might want to do a randomised control trial and give one group the real drug and a placebo to the other, that way, any difference detected regarding the outcome, could be attributed to the drug.
Whether you have a question or set of questions to answer, how you collect the data matters and that is why it is one of the most important pieces of the statistics puzzle. Especially because after all, without data to analyse we would be left with theoretical work only. Theory is extremely important, of course, but you need people and data to prove/use them as well. There is also an important difference to keep in mind, data gets collected for many, many purposes and collecting data from transactions at a supermarket is not the same as collected information from a group of interest (e.g. survey, focus groups, experiments, etc.).
Collecting data can also be done by clicking a button and downloading a table full of content that can be opened in excel (structured data), or it can be as difficult as conducting an experiment with human subjects, or (although not the same) crawling over many websites to get (unstructured) data and then formatting it into a more usable structure. Here are two examples of how we might encounter data in the wild:
Structured
| Name | Income | Age | Favourite Brand |
|---|---|---|---|
| Abraham | 70,000 | 25 | Nike |
| Lisa | 110,000 | 31 | Apple |
| Bella | 80,000 | 24 | Garmin |
| Penelope | 55,000 | 49 | Microsoft |
| Mikaela | 74,000 | 51 | ZARA |
| Nicholas | 61,000 | 36 | Adiddas |
Unstructured

Source: https://www.lubys.com/recipes
Notice that in the example above, the structured data resembles what we are used to seeing when we use or think of data. On the other hand, we might not be used to thinking that recipes from a restaurant, emails, poems, social media posts, all qualify as data as well but in a different format. The most notable differences being the immediate usability of the two and the unclear picture as to how to set it into a structured format.
As analysts, we can collect data through surveys, purchasing history (these are often stored automatically into a database like SQL or NoSQL), by tracking visits to a website, and many more. The information we get in a dataset, the data in its variables (or in excel lingo, the columns), is often represented in three ways: as categorical and quantitative information and as date-related data (e.g. years, months, time, etc.).
Categorical data represent groups or specific characteristics of the data. For example, a column called gender that contains whether a survey participant was a male, female, or other, will count as a categorical variable. This type of classification, gender, counts as a specific type of categorical data called nominal.
Nominal data is the type of data that can be classified into groups but with no particular order to it. In the example of gender, we cannot say that female is greater than male or vice-versa. This takes us to our next type of categorical data, ordinal.
Ordinal data are the type of data where order matters. Imagine you have a dataset with formula one drivers in the rows and all of the characteristics regarding their professional careers in the columns. If we were to have a variable for every race in which the drivers competed, plus their placement within each race, keeping the order in which they crossed the finish line would be crucial in order for our dataset to be meaningful. Especially since first has a higher value than second, and, of course, last. Another example of ordinal data is the temperature of a meal ordered at a restaurant. If we order a stake cooked medium-well, we would expect to get the stake at a temperature within that range. In this scenario, the order of the categories would go from hot to cold, and that matters in an analysis.
Quantitative data, on the other hand, represents numerical data that can be quantified, summarized, averaged, and visualized, usually in as many or more ways than categorical data. Especially because we can bin quantitative data into groups of categories but the reverse is not true. Quantitative data can be income, revenue, stock prices, miles, weight, height, and many more.
It is important to notice that categorical data, whether nominal or ordinal, can still be collected in a numerical format without it being considered quantitative. Say we collect data for the level of spiciness of different meals at a restaurant and assign these values the numbers 3 (hot), 2 (medium), and 1 (not spicy), they would still be considered categorical data even though it would now be represented by a numerical value.
Statistical Data Collection
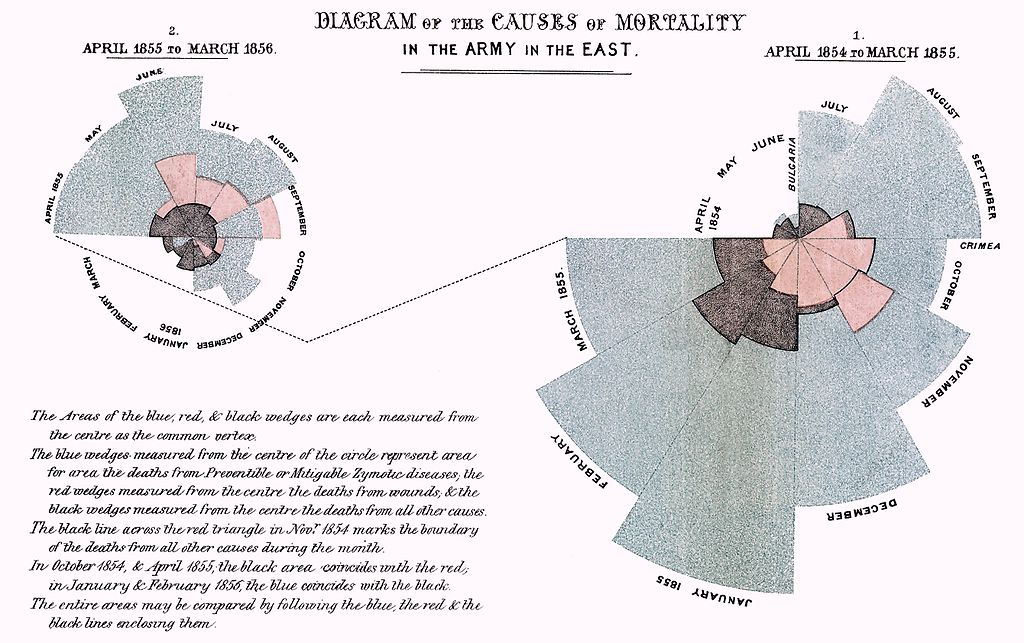
Source: Florence Nightingale
When we collect data specifically for statistical purposes we want to gain knowledge or learn about something that is important to us. There are two ways in which statistics concerns itself when it comes to data collection, and those are through observation and experimentation.
An important point to keep in mind is that, although we might have an idea of what the population we're interested in looks like, or what the magnitude of the data we need might be, we would hardly ever collect enough data to make a 100% prediction or inference based on it. With that said though, there are many techniques and sampling methods that do allow us to get pretty close to our desired outcome. Let's first define what observational and experimental studies are.
Sample Study: a study where we try to estimate the true value of a parameter based on a sample of the real population. A parameter in this case would be a piece of information such as the mean, median, and mode in a sample regarding our question of interest. If we wanted to know how many people per country, on average, believe in global warming, asking everyone in the planet would be impossible. But by asking a random sample of people from each country, we could approximate the true average of people that believe in global warming.
Observational Study: In these kinds of studies, we are interested in a particular subsection of the population and we would like to determine what causes what without intervening with the sample being studied. For example, say we want to study the relatioship between smoking and drinking and whether one causes the other and vice-versa. We would observe people in their natural environment and collect data about what happens when these actions take place. We would then different statistical techniques to try to arrive at the root of our question, what causes what, if such causal link exists at all.
We also need to be cautious when, upon first inspection, all of our assumptions seem to match. A high correlation between both, smoking and drinking does not mean that one causes the other. It could be that there is a confounding variable behind the scenes controling the outcomes. For example, drinking and smoking could be due to being in a circle of friends where everyone smokes. It could also be a habbit triggered by the cue, for example, beign out with friends socialising. Confounding variables, or for that matter, the real causes of a phenomena, are often hard to pick appart but not impossible.
Experimental Study: Experiments are the toughest ones to conduct but are also the ones that can get you the closest to determine a causal effect between two or more variables. With experiments we are in search of what causes what and we might even go to great lenghts to pick a random sample of people, then assign them to different random groups, and induce the variable of interest to half of that sample and a placebo to the other. These two groups are also called, control and treatment group. If the size of the difference between the two groups is large or significant enough once the experiment ends, it can be possible to determine causation.
There are other concepts in data collection that, although they are beyond the scope of this course, you are higly encouraged to explore further. These are,
- Different sampling techniques
- Cluster sampling
- Stratified sampling
- Simple random sampling
- Systematic sampling
- Snowball sampling
- ...
- Selection bias
- Qualitative data collection (e.g. focus groups, interviews, etc.)
- Quantitative data collection (e.g. experiments)
5. Descriptive Statistics
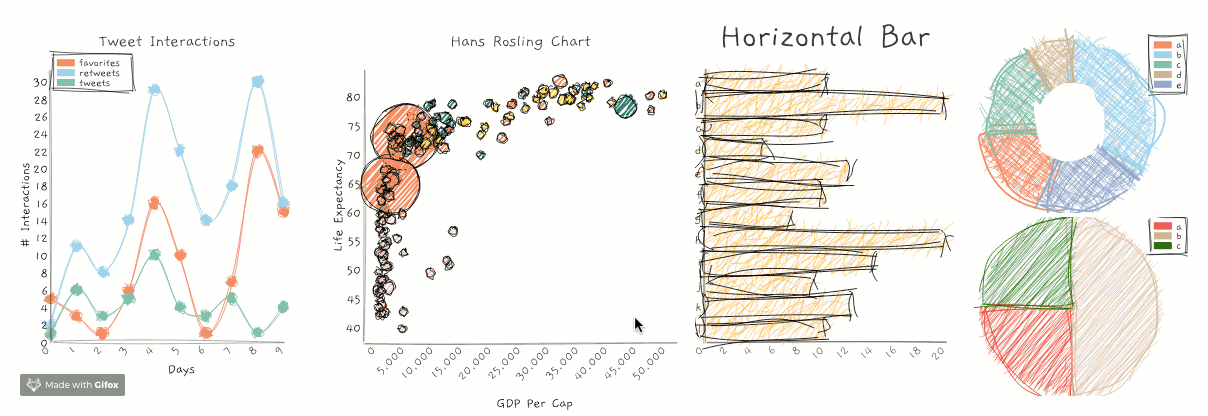 Source: https://github.com/jwilber/roughViz
What are descriptive statistics?
Descriptive Statistics is the process of describing and presenting your data. This is usually done through tables, visualisations and written descriptions of data. For example, if you conduct a survey to find out how much people like a particular brand, you will want to report the number of people that took the survey (the count), the average, minimum, and maximum age or even the median income of every respondant. With these data alone, we could move onto to making more informed and important decisions.
In the previous survey example, every survey taker would be a row, and every question in that survey would form the columns (see the table below). Income, age, and favourite brand, would all represent different arrays or vectors of information in a two-dimensional matrix or dataset.
| Name | Income | Age | Favourite Brand |
|---|---|---|---|
| Abraham | 70,000 | 25 | Nike |
| Lisa | 110,000 | 31 | Apple |
| Mark | 80,000 | 24 | Garmin |
| Penelope | 55,000 | 49 | Microsoft |
| Michaela | 74,000 | 51 | ZARA |
| Nicholas | 61,000 | 36 | Adiddas |
Every one of these arrays can represent a categrorical or quantitative variable. Since data are often messy and even unstructured, we might also find other data structures, or free text (long strings) as the elements of a table like the one above. For the most part though, we will focus on the two types of variables we will often see, quantitative and categorical variables to describe our dataset.
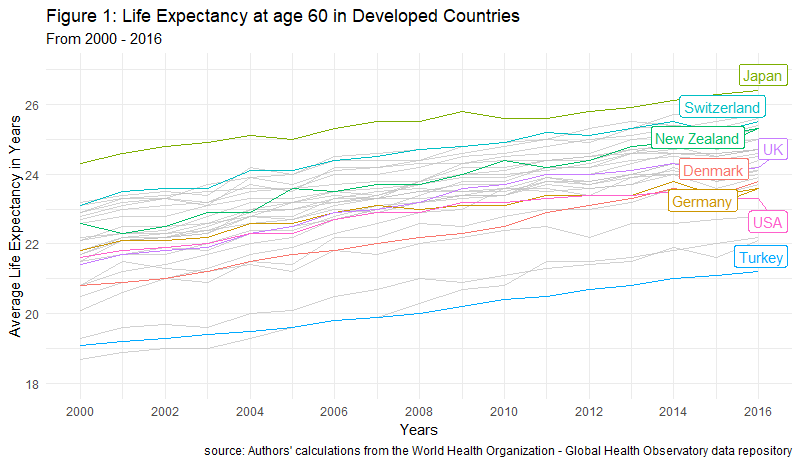
Descriptive statistics are often shown through tables and visualisations. For example, imagine you'd like to know how the average life expectancy of people at age 60 in different countries has changed over time. That visualisation would look like the one below.
So what should we look for when we want to describe data? We want to look for information that gives us facts about the data, such as the most common value of a set of characteristics, how far is a given value in a variable from the average value of that same variable (e.g. how far is the age of a teacher selected at random in all the schools in Sydney from the average age of all teachers in New South Wales). These two kinds of values, the average of a set and the variability of each value in a set, are part of what is known as measures of central tendency and measures of variability, respectively.
Measures of Central tendency, also classified as summary statistics, are calculations that help us describe any data point in our dataset in relation to the most common values. The most common determinants of central tendency are the mean, median, and mode.
Measures of Variability tell us how spread-out our data is. Think about this as how much variation there is, whether up or down, in the income of your closest friends to that of the income of the average Australian. That distance from the income of your friends to the most common income (the average of all) gives us insights as to how much income variability there is in the entire population of Australia. In this instance, your friends would be consider a sample of the population. The most common measures of variability are the range, variance and standard deviation.
How do we describe categories and quantities?
Categorical variables can be shown using frequency tables and visualisations where each category of the variable is given a number representing the amount of times that category was found in the dataset. For example, a question in a survey containing answer choices ranging from Strongly Agree to Strongly Disagree will have 5 categories.
Quantitative variables, on the other hand, can be summarised with averages, percentiles, scatterplots, etc., and tend to provide different perspectives and insights than qualitative variables.
The most useful set of facts we will need will often come from a combination of both, qualitative and quantitative variables. Nontheless, Descriptive Statistics are not only an essential step in the data analytics cycle but are also specially useful when we have a lot of data and want to convey relevant a message with relevant information fast.
We will go over the most important descriptive statistics (with code) in the following notebooks.
6. Inferential Statistics

Statistical inference is one of the divisions of statistics that deals with what cannot (or has not) been observed in the data. It is the side of statistics used to make predictions about what might happen in the future based on what has happen in the past. In other words, it helps us estimate, among many things, some degree of uncertainty in the future (something we don't know anything about).
Another way for thinking about inferential statistics goes as follows. We have evidence about the characteristics of all of the observations in our sample, the true parameters of the population are unkown but we can approximate an answer to the true parameters if the sample is large or representative enough. In this scenario, we would like to make an inference or educated guess about the truth, and representative would mean that we capture as much variation as possible in the sample as that which we could expect in to see in the population
Three broad goals of statistical inference are parameter estimation, prediction, and model comparison.
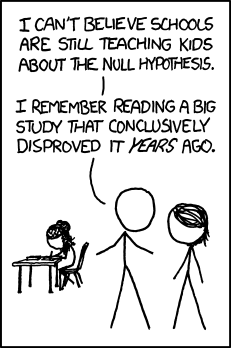 **Source:** https://xkcd.com/892/
Questions
- What is Statistics?
- What is "a Statistic"?
- What are the three broad areas of Statistics and how does one define them?
- What is one way in which we can collect data?
- What is Statistics useful for?
- How can Statistics be harmful?
- What are measures of central tendencies?
- What is an Observational Study?
- What are the 2 types of categorical variables?
- What is an experimental study and can you think of an example of it?
References
Herne, H., & Huff, D. (1973). How to Lie with Statistics. Applied Statistics, 22(3), 401. doi: 10.2307/2346789
Downey, Allen B. Think Stats: Exploratory Data Analysis in Python. Green Tea Press, 2014.
Lock, Robin H., et al. Statistics: Unlocking the Power of Data. John Wiley & Sons, 2019.